Draw boat glyphs for orientation data
boat3d.RdDraws a stylized sailboat to represent an orientation.
Arguments
- orientation
An
orientationobject to be shown.- x, y, z
Coordinates where boats should be shown.
- scale
Size of boats
- col
Colour of boats
- add
Context in which to continue drawing, or
FALSEto clear first.- box
Whether to draw a box around the plot
- axes
Whether to draw axes
- graphics
Which graphics package to use
- ...
Additional graphics parameters; see Details below
Details
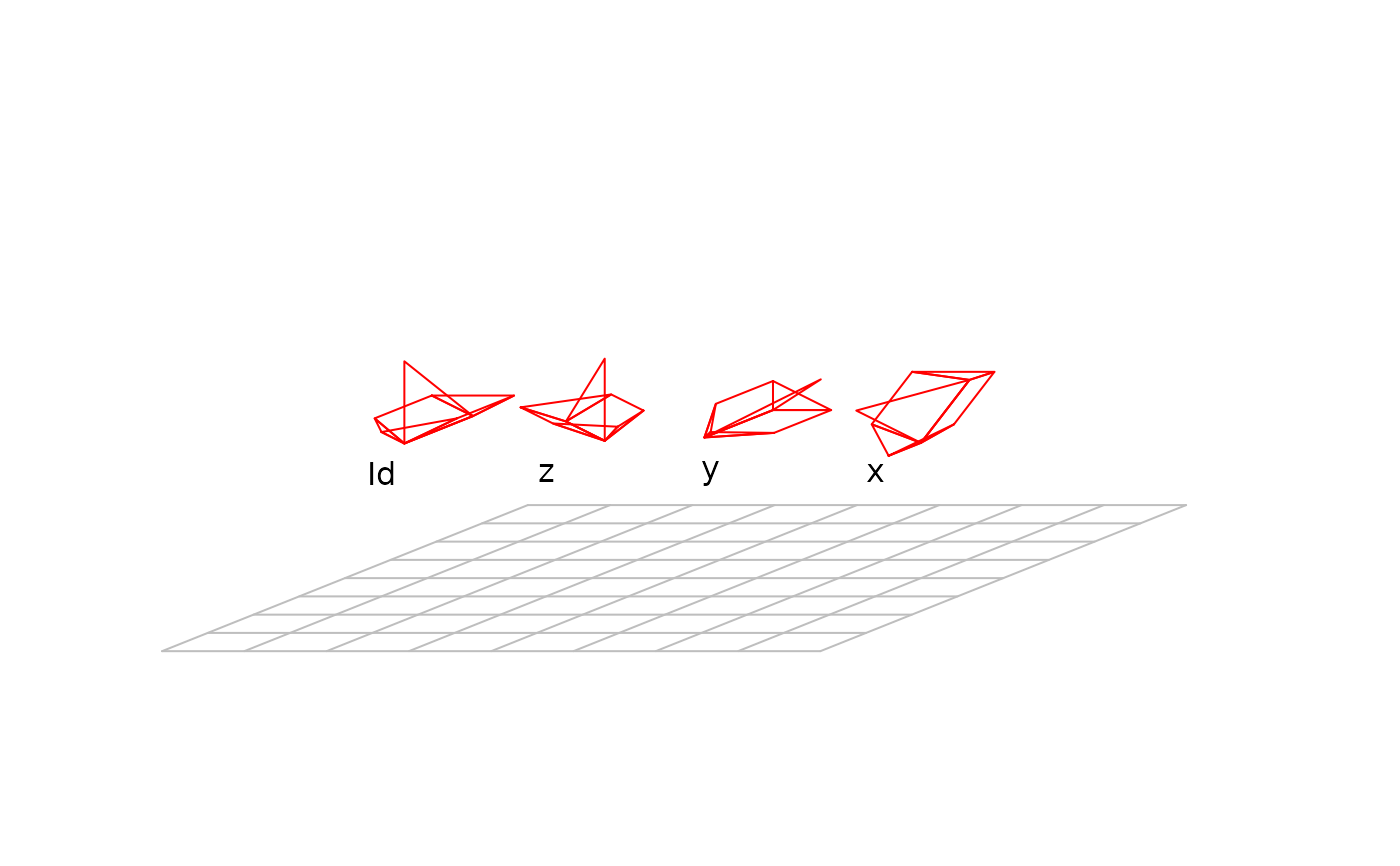
For the identity orientation, the sailboats will be shown upright. Other orientations are shown as rotations of this glyph.
The (x,y,z) coordinate appears in the middle of the sail, at the top of the gunwales of the boat.
If the rgl package is
installed, it will be used to draw solid faces on the boats which can be moved by the
user. If not, but the scatterplot3d package is
installed, it will be used to draw fixed wireframe boats. This
search order can be changed by modifying the graphics parameter.
Additional graphics parameters may be passed. If scatterplot3d is used, these
are passed to the scatterplot3d function (and ignored
when adding to an existing plot). Extra parameters are not passed to
rgl.
To add to a scatterplot3d plot, you must pass the
return value from the initial plot as the value of add. See
the orientlm function for an example.
Value
A current
plot number for rgl, or a scatterplot3d
drawing context. In any case, an attribute named graphics is added
to indicate the drawing device type.
Note
Requires the rgl or
scatterplot3d package.
Examples
x <- eulerzyx(psi=c(0,pi/4,0,0), theta=c(0,0,pi/4,0), phi=c(0,0,0,pi/4))

# Need a 3D renderer; assume scatterplot3d, but others could be used

s <- boat3d(x, 0:3, axes = FALSE, graphics = 'scatterplot3d')
#> Loading required namespace: scatterplot3d
text(s$xyz.convert(0:3, rep(-0.5,4), rep(-0.5,4)),
     label = c('Id','z','y','x'))


if (FALSE) {

# if the rgl package is installed, this code will work

boat3d(x, 0:3, axes = FALSE, graphics = 'rgl')
rgl::bbox3d(xat=0:3,xlab=c('Id','z','y','x'),yat=1,zat=1,color='grey')
}
if (FALSE) {
# if the rgl package is installed, this code will work
boat3d(x, 0:3, axes = FALSE, graphics = 'rgl')
rgl::bbox3d(xat=0:3,xlab=c('Id','z','y','x'),yat=1,zat=1,color='grey')
}